


If your scan tool is capable of reading a data stream, there are a couple of tests you can perform that will save you time when you’re dealing with a complex diagnosis.
Quick Go/No-go tests for 2 and 3 circuit sensors
If you need to verify whether or not you have a sensor problem, your scan tool can give you a quick answer. To test a 2-wire sensor, such as a coolant sensor, or any thermistor, disconnect the harness connector and the scan tool data PID temp should go very low, in most cases (negative) 40 degrees Fahrenheit. Next, jumper the ground to signal and it should go extremely high, in most cases somewhere above 260 degrees Fahrenheit. Anything in between is a circuit problem and not a sensor failure.
Similarly, to test a 3-wire sensor circuit, disconnect the sensor connector, and while viewing its data PID voltage, jumper the VREF to the signal. This should display the VREF full value on the scan tool. Then, jumper the ground to the signal and the scan tool should display zero voltage. Anything other than that is a circuit problem and not a faulty sensor. If the ground-to-signal shows any voltage there is a short to power on the ground side. If the 5v to signal shows less than 5v there is unwanted resistance in the circuit.
Scan Tool MAF Sensor Testing
Graph the MAF in Grams Per Second, Frequency, or Voltage. It does not matter which you choose. If your scan tool does not have graphing capabilities you can alternatively mark captured values on graph paper and plot readings at 1000 RPM, 1250 RPM, 1500 RPM, 1750 RPM and 2000 RPM.
- Mark the readings on the graph. Plot them at 250 RPM increments from 1000 RPM.
- The graph plot points should be in a rising straight diagonal line.
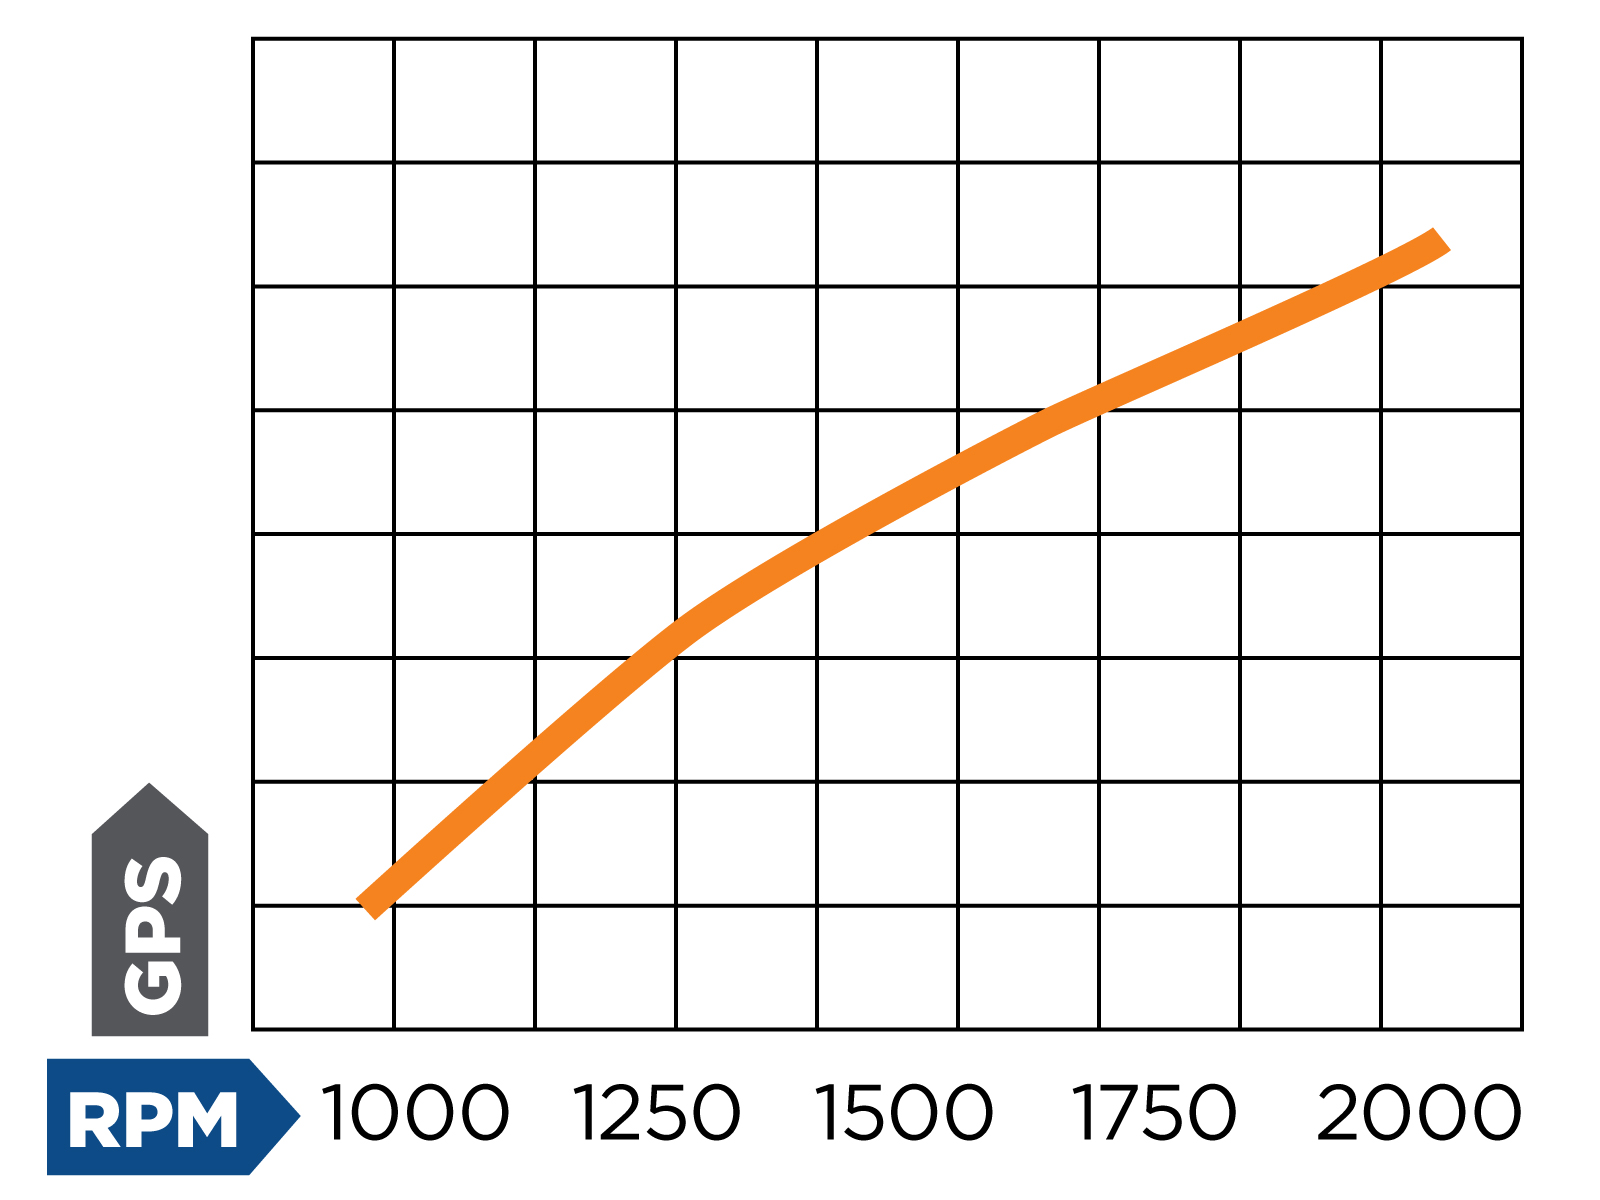
- This graph shows a good MAF as it increases with speed in linear graph pattern.
- If you have a dual trace scan tool you can plot the TPS and MAF, they should parallel each other as RPM increases.
- Adding a graph reading of LTFT (long-term fuel trim) will also show if the MAF is out of calibration.
- If there is a large difference in the LTFT from idle to cruise it could mean there is a contaminated MAF sensor.
- The MAF in the graph above would give low power or acceleration symptoms.
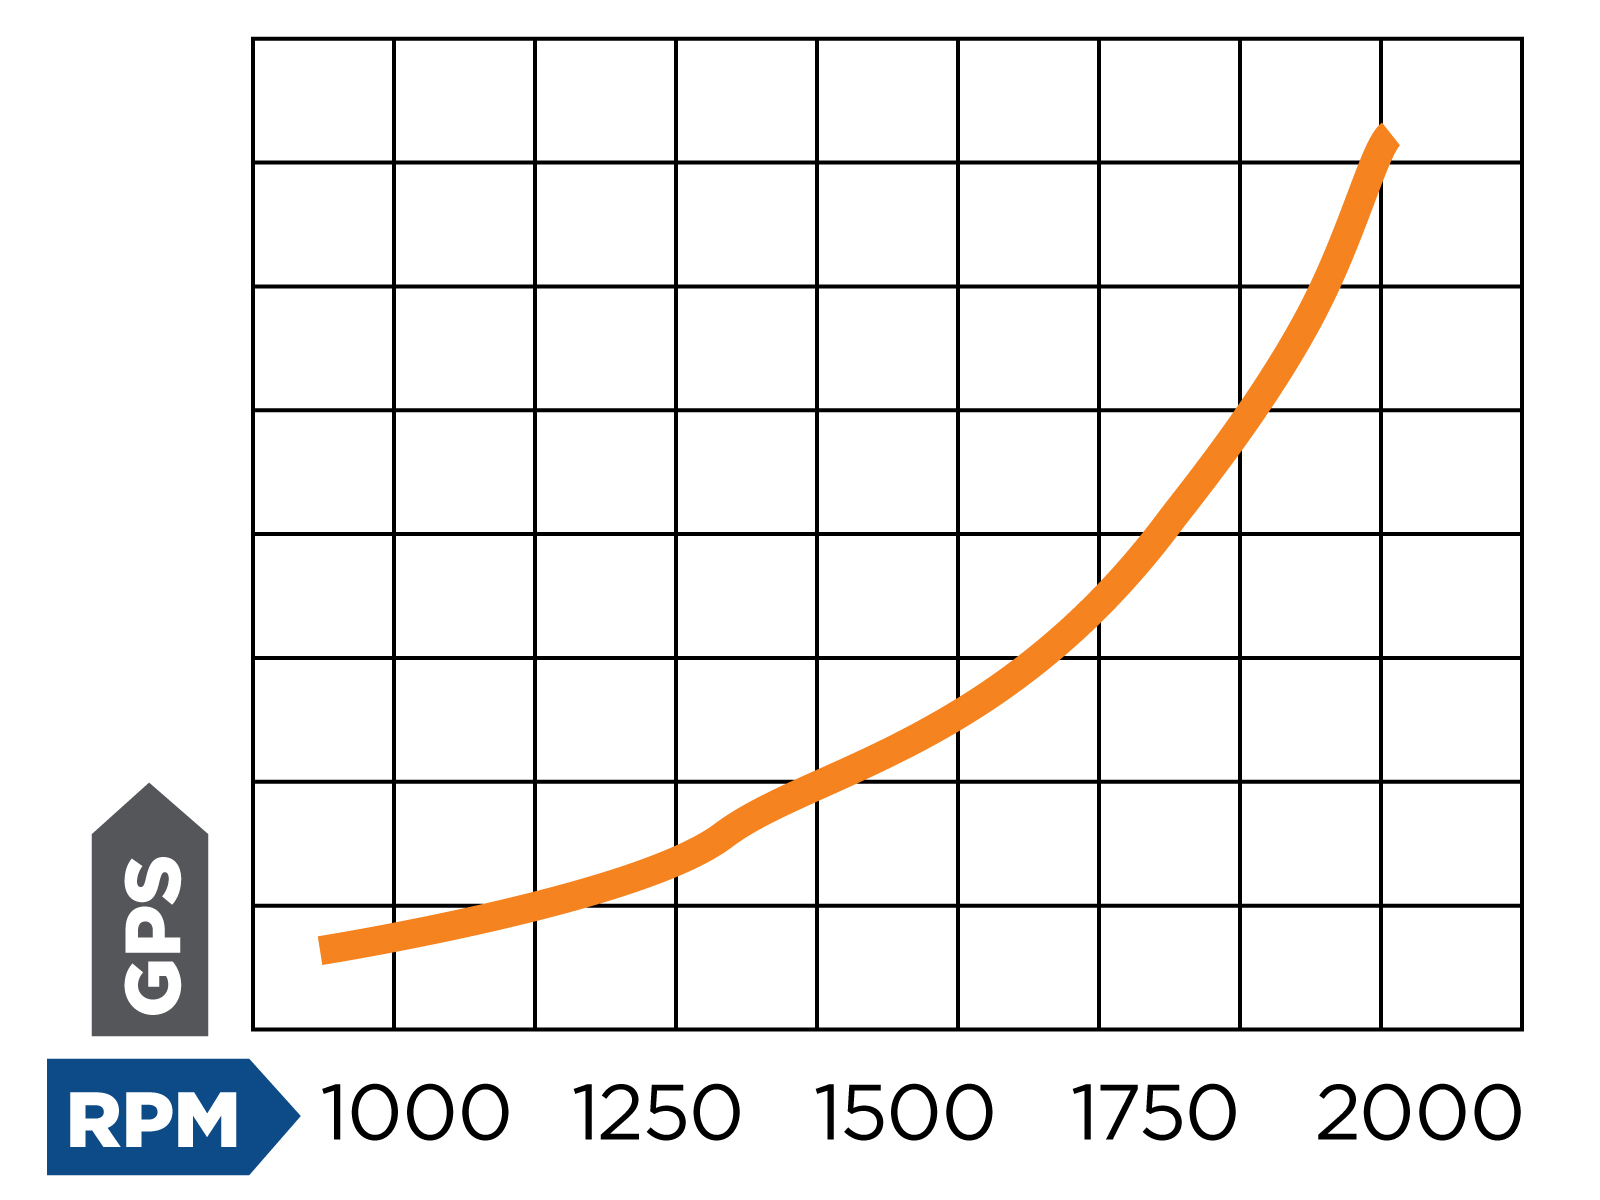
On the other hand, if the MAF Sensor output increases too fast in reaction to an increase in RPM, the PCM would quickly increase the injector pulse-width at the lower end of the RPM scale causing an acceleration problem. The MAF Sensor may be out of calibration.
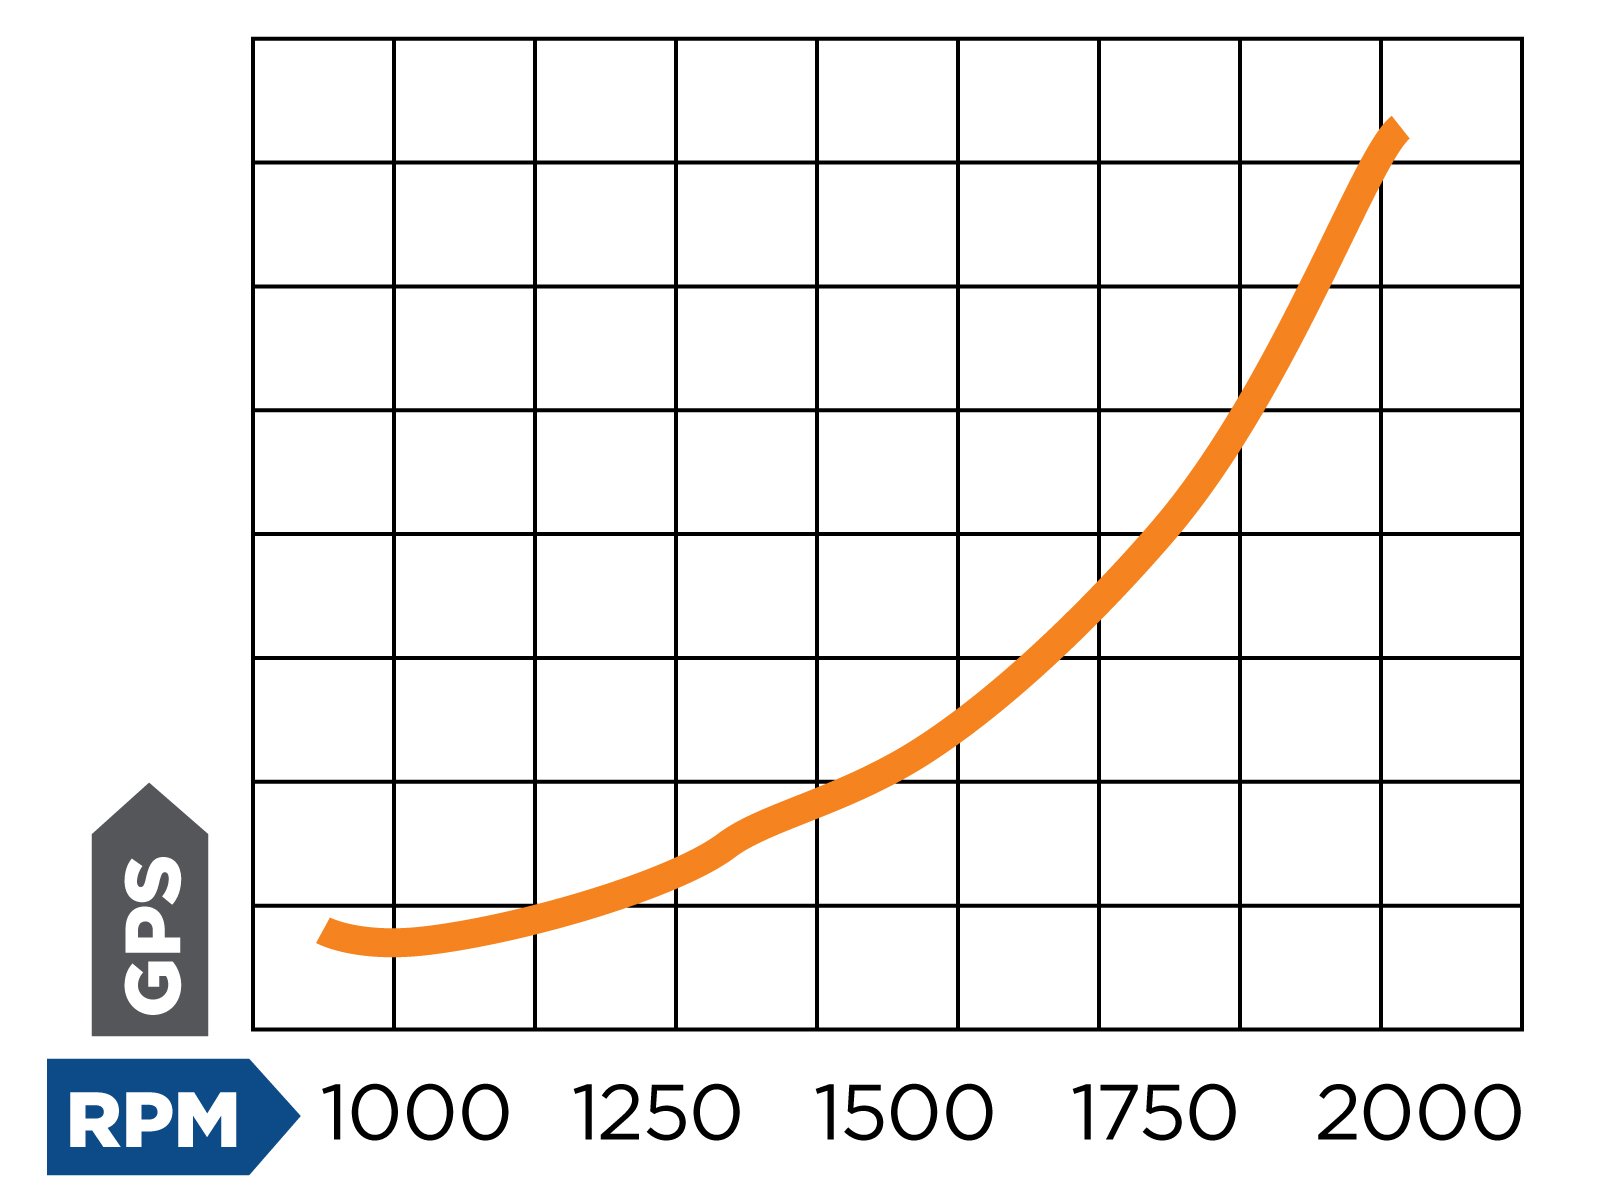
- This graph shows either a dirty sensing wire or an air leak affecting the MAF Sensor. Check for dirty sensing wire on the MAF Sensor.
Often there is a need to quickly identify if you have a bad sensor. By using your scan tool, you can quickly determine if that is the problem or not.
Want to see how ALLDATA can improve shop efficiency? Check out our suite of products, each designed to contribute to both shop efficiency and productivity.
If you would like to read more articles like this one please subscribe to ALLDATA News.
